

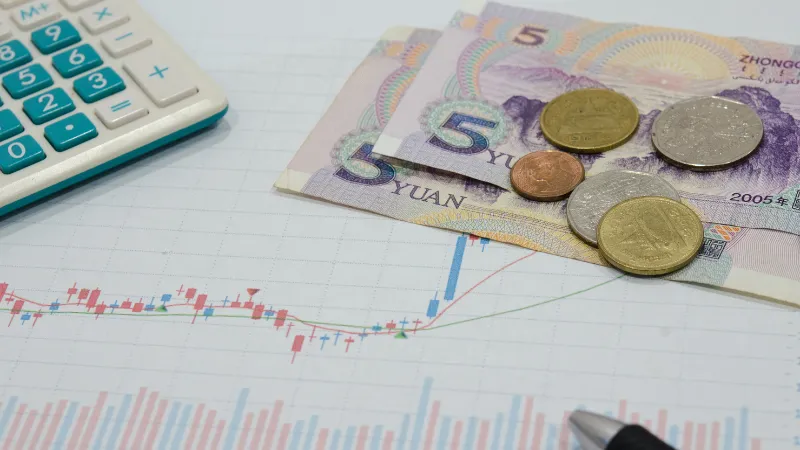
The foreign exchange market can change direction within minutes. A currency pair may open the day quietly, react sharply to an economic announcement, and settle into a completely different range by afternoon. For anyone following these movements, a forex live chart can turn scattered price changes into a visual record that is easier to study and interpret. But a chart becomes genuinely useful when traders know what its movements represent, which signals deserve attention, and how broader market conditions influence price.
 Follow us
 Follow us
Reading Price Movement Over Time
A chart does more than display the current exchange rate. It shows how price has behaved across a selected period.
Short timeframes can reveal rapid movements that occur within minutes or hours. Longer timeframes may expose broader trends that are less visible on an intraday chart. Looking at multiple timeframes can therefore provide additional context.
For example, a currency pair may appear to be moving upward on a five-minute chart while remaining inside a larger downward trend on a daily chart. Both observations can be correct because they describe different periods.
RECOMMENDED FOR YOU



Striking the Right Balance: How Much Data Should Startups Gather from Customers?
Team SR
Oct 16, 2025
Understanding Candles And Price Ranges
Candlestick charts are widely used because each candle communicates several pieces of information. Depending on the selected timeframe, a candle can show the opening price, closing price, highest price, and lowest price during that period.
The body indicates the distance between the opening and closing prices, while the upper and lower wicks show price extremes.
A series of candles can reveal whether buying or selling pressure has been increasing, decreasing, or fluctuating. However, a single candle rarely provides enough information to explain why a market moved.
Tracking Support And Resistance Areas
Some price zones attract repeated market attention. A support area may represent a level where buying interest has previously appeared, while resistance can indicate an area where selling pressure has emerged.
These are not guaranteed turning points. Instead, they are reference areas that can help traders examine how price behaves when it approaches familiar levels on a forex live chart.
Suppose a currency pair repeatedly struggles to move above a certain zone. A later approach to that area may deserve closer observation. Traders can then examine whether price breaks through, reverses, or consolidates nearby. This makes support and resistance useful for organizing market observations without treating them as certain outcomes.
Connecting Charts With Economic Events
Currency prices are closely connected to economic conditions. Interest-rate decisions, inflation reports, employment data, central-bank statements, and economic growth figures can all influence expectations about a country's currency.
When important data is released, price movements can become unusually sharp. A chart may show a sudden spike or decline that looks dramatic without the surrounding economic context.
Adding the event to the analysis changes the interpretation. Instead of simply seeing a large candle, the observer can consider whether the movement followed a policy announcement, economic report, or shift in market expectations.
Comparing Major Currency Relationships
Forex markets contain numerous currency pairs, but major pairs often receive significant attention because they connect widely traded currencies.
Comparing related pairs can sometimes provide additional context. For instance, movements in the U.S. dollar can influence several dollar-based pairs at the same time, although the size and direction of each movement may differ.
Crosses that do not include the dollar can also behave differently because their prices reflect the relationship between two other currencies.
Using Volume And Market Activity Carefully
Volume can provide another layer of information, although forex volume requires careful interpretation because the global currency market does not operate through one centralized exchange. A forex live chart can display volume alongside price movements, helping traders observe activity within the available market data.
Depending on the charting source, displayed volume may represent activity from a particular broker or data provider rather than the entire global market.
This distinction matters. Volume-related information can still be useful for studying activity and price behaviour, but it should not automatically be treated as a complete measurement of worldwide forex trading.
Recognizing Trend And Consolidation Phases
Markets do not move in one direction continuously. Currency pairs can alternate between trending periods and consolidation phases.
During a trend, price may create a sequence of higher highs and higher lows or lower highs and lower lows. During consolidation, price may remain within a narrower range while traders assess competing market information.
Recognizing the difference can help explain why some chart patterns develop slowly while others produce rapid movements.
Combining Technical Tools With Context
Technical indicators can help organize information already visible in price data. Moving averages, relative strength indicators, trend tools, and other calculations are commonly used to examine momentum, direction, or potential changes in market behaviour.
However, indicators are based on price data and should not be treated as independent predictions.
The value comes from combining these observations with price structure, timeframe, economic information, and risk considerations.
Making Live Data More Useful
Real-time currency information is most valuable when it supports a clear analytical purpose. Watching every small fluctuation can create noise, particularly during highly active market periods.
Instead, traders and market observers can focus on meaningful changes such as breaks from established ranges, reactions around major price levels, unusual volatility, or movements following economic announcements.
A live chart can make these developments easier to follow because it presents changing prices in a continuous visual format. The important step is knowing which movements deserve attention and which are simply normal market fluctuations.
Conclusion
A currency chart is ultimately a record of changing relationships between economies, interest-rate expectations, market sentiment, and global events. The line on the screen is only the visible result of those forces.
Learning to read that line requires more than recognizing whether prices are moving up or down. It involves understanding currency pairs, timeframes, price structures, economic releases, volatility, and the limitations of available data.
For anyone studying foreign exchange markets, a forex live chart can serve as a practical starting point for observing these relationships as they develop. Used alongside reliable economic information and a consistent analytical process, it can turn constantly changing prices into a clearer picture of how the currency market is behaving.
Recommended Stories for You

Team SR Aug 17, 2026


Team SR Apr 24, 2026


Team SR Apr 24, 2026

Team SR Aug 10, 2026
Trending Stories
AI Generated Video Needs A Startup Acceptance Gate

Tips For a Smooth and (Cyber)Safe Team Workation

Seven Tools (and Ops) Every UK Startup Should Set Up Before Day One

Credit Math For An AI Map Generator On Seed Budget

What Advisers Should Expect from a Modern Mortgage Network
5 technical choices that make the difference between growth and stagnation

How Trading Platforms Are Using AI and What’s Actually Working

Speech to Text AI: What’s Actually Driving Enterprise Adoption in 2026