

 Follow us
 Follow us
The best MySQL query profiler answers a simple question: which query is actually costing us? Across cloud-native and high-concurrency systems today, inefficient SQL is the cause of most performance problems, not hardware. Such queries often consume most CPU, memory, and disk I/O, yet remain difficult to identify before they impact production.
The underlying reason is architectural. Modern databases operate within distributed cloud deployments, containerized microservices, BI workloads, and real-time applications. At this level of complexity, manual EXPLAIN checks and reactive debugging rarely reveal true workload impact.
This guide reviews the best MySQL query profiler tools teams can use to find, analyze, and fix these high-impact queries before they degrade performance.
Summary
- Identify high-impact queries by total latency and frequency.
- Validate optimization decisions using execution plan analysis.
- Detect indexing and concurrency bottlenecks early.
- Prevent performance regressions during deployments.
List of Top MySQL Query Profiler Tools for 2026
The following tools represent the most practical MySQL query profiling solutions used in modern development and production environments. They include commercial platforms, open-source monitoring stacks, native MySQL instrumentation, and IDE-integrated profilers designed for different operational needs.
They are ordered by overall usefulness across common professional scenarios, with the first tool serving as the strongest general recommendation.
Quick Comparison Table
The following table highlights the criteria that most influence real-world performance diagnosis: profiler type, execution plan visibility, production suitability, and ideal use case.
TL;DR
- Best overall for developers & DBAs: dbForge Studio for MySQL.
- Best for cloud-scale monitoring: Datadog Database Monitoring.
- Best open-source solution: Percona Monitoring and Management (PMM).
- Best for enterprise-wide visibility: SolarWinds Database Performance Analyzer.
- Best built-in option: MySQL Workbench + Performance Schema/sys.
| Tool | Type | Execution plan visualization | Best for | Learning curve |
| dbForge Studio for MySQL | Desktop IDE | Yes (visual) | Developers & DBAs | Low |
| Datadog Database Monitoring | SaaS platform | Partial | DevOps / SRE teams | Medium |
| Percona Monitoring and Management (PMM) | Open-source platform | No (only EXPLAIN output) | Infrastructure teams | High |
| SolarWinds Database Performance Analyzer (DPA) | Enterprise solution | Partial | Large organizations | Medium |
| MySQL Workbench + Performance Schema/sys | Native / built-in | Yes (visual) | Advanced DBAs | High |
Next, let’s review each tool individually using a structured approach to highlight where it excels and where it may fall short.
1. dbForge Studio for MySQL
⭐4.7/5 on G2

RECOMMENDED FOR YOU


Best for: Developers and DBAs who want integrated query profiling within their daily SQL workflow.
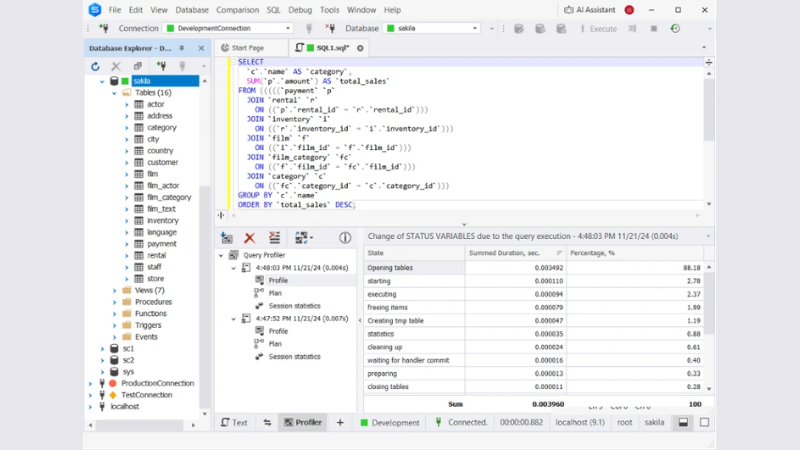
dbForge Studio for MySQL and MariaDB is a desktop MySQL IDE for Mac, Windows and Linux that integrates query profiling directly into the SQL development workflow. Unlike external monitoring platforms, it emphasizes iterative optimization within the coding environment, enabling developers and DBAs to analyze execution behavior and refine queries without leaving the IDE.
| Category | Details |
| Features | • Integrated Query Profiler • Visual execution plan diagrams • Query execution metrics (duration, per-stage delays, rows processed) • Index analysis tools • SQL formatting and autocompletion |
| Pros | • Profiling built directly into IDE • Clear visual execution plans • Efficient test–adjust–retest workflow • Suitable for frequent optimization tasks |
| Cons | • Windows-focused desktop application • Advanced features require paid edition |
| Price | Trial: 30 days to evaluate Query Profiler (included only in paid editions) Express: Free Subscription plans start at: • $9.95/month (Standard) • $19.95/month (Professional) • $29.95/month (Enterprise) |
| Compatibility | • Windows • macOS and Linux (via compatibility solutions such as Wine, CrossOver or Parallels) |
User review
“I think it is a pretty good tool, I particularly like the autocomplete, the Data Comparison and Sync. In some cases the Pivot table and query history helped me a lot to debug or check the data. Database diagrams are also very useful too for design and check the relationships between tables.” — Verified G2 user
Case in point
KS EDV Consulting adopted dbForge Studio for MySQL to replace cumbersome command-line workflows and improve database development efficiency. According to CEO Alf Krause, the tool significantly optimized their processes, with the built-in Query Profiler playing a key role by helping the team tune query performance quickly and intuitively.
The result was measurable impact, including faster scripting and development cycles and an estimated 300% productivity increase across their DevOps operations.
2. Datadog Database Monitoring
⭐ 4.6/5 on Capterra
Best for: DevOps and SRE teams managing MySQL across multiple services and production environments.
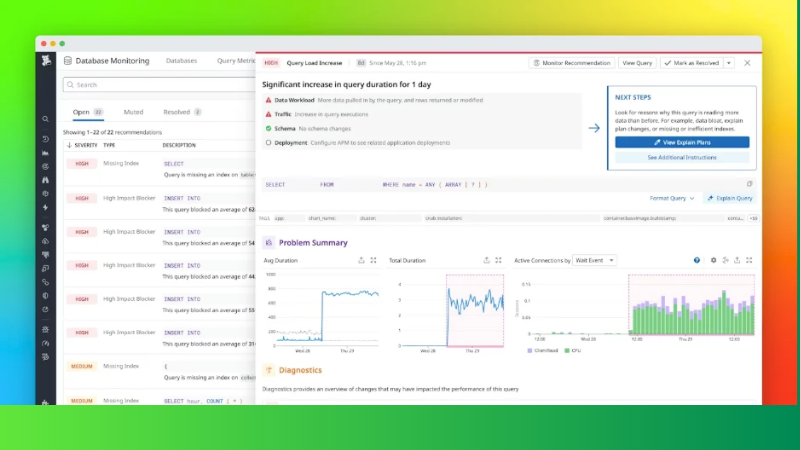
Datadog Database Monitoring is a SaaS observability platform that tracks MySQL query performance within live production environments. Rather than focusing on local query optimization, it monitors how queries behave under real traffic and correlates their impact with infrastructure, deployments, and application performance.
| Category | Details |
| Features | • Real-time query performance monitoring • Query samples and latency analysis • Correlation with infrastructure and APM data • Performance dashboards and alerting • Regression detection after deployments |
| Pros | • Unified observability across services • Strong alerting and incident integration • Scales across cloud and distributed environments • Suitable for production-first monitoring |
| Cons | • SaaS-only deployment model • Higher cost compared to local profiling tools • Less focused on interactive SQL optimization |
| Price | • $70 per database host per month (billed annually) • Higher pricing for on-demand/month-to-month plans |
| Compatibility | • Cloud and on-prem environments • Integrates with AWS, Azure, GCP, Kubernetes, and APM stacks |
User review
“Overall, I find it to be a valuable tool that has generally fast queries and dependable uptime. I appreciate the flexible alert conditions and monitors.” — Verified Capterra user
3. Percona Monitoring and Management (PMM)
⭐ 4.5/5 on G2

Best for: Infrastructure-focused teams that want full deployment control and advanced query analytics without licensing costs.
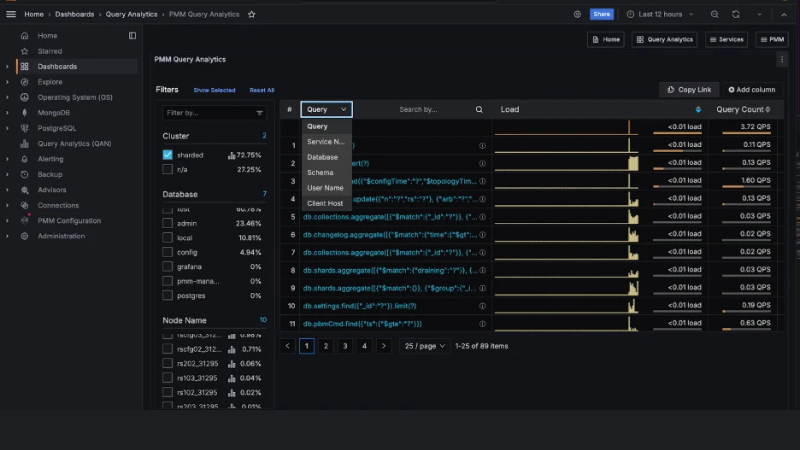
Percona Monitoring and Management (PMM) is an open-source observability platform that provides MySQL query analytics alongside system-level monitoring. It combines query performance insights with infrastructure metrics, offering cluster-wide visibility for teams that prefer to self-host and manage their monitoring stack.
| Category | Details |
| Features | • Query Analytics (QAN) for MySQL • System and node-level monitoring • Cluster-wide performance dashboards • Historical performance trend analysis • Self-hosted deployment (on-prem, cloud, hybrid) |
| Pros | • Open-source and free to use • Deep visibility into query and system metrics • Full deployment control • No per-host licensing fees |
| Cons | • Requires setup and maintenance • Higher operational overhead • Steeper learning curve than SaaS tools |
| Price | • Open-source (free) • Paid enterprise support and services available via Percona |
| Compatibility | • On-premises deployments • Cloud and hybrid environments • Linux-based server environments |
User review
“PMM tool's best feature is that Easy can be integrated with Self-host DB as well as On Cloud Database services. the metrics which configure mostly for Mysql are the best in the segment.” — Verified G2 user
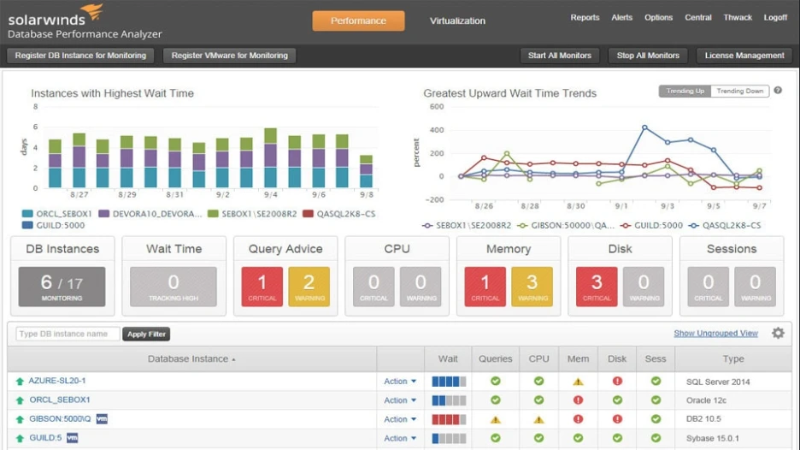
4. SolarWinds Database Performance Analyzer (DPA)
⭐ 4.5/5 on G2

Best for: Large organizations that require standardized, enterprise-grade database performance diagnostics across multiple instances.
SolarWinds Database Performance Analyzer (DPA) is an enterprise-focused database performance monitoring platform designed for sustained diagnostics across cloud and on-prem environments. It emphasizes historical trend analysis, workload baselining, and standardized reporting rather than ad-hoc query tuning within development tools.
| Category | Details |
| Features | • Historical performance trend analysis • Workload baselining and anomaly detection • Query performance diagnostics • Cross-platform database support • Centralized reporting dashboards |
| Pros | • Strong historical visibility • Suitable for multi-instance environments • Enterprise-grade reporting • Structured diagnostic workflows |
| Cons | • Higher cost compared to open-source tools • Enterprise-focused procurement model • Less interactive for developer-level tuning |
| Price | • Subscription-based licensing • Product page references pricing from ~$1,699 • Reseller listings commonly show ~$1K–$2K+ per instance/upgrade SKU |
| Compatibility | • Cloud and on-prem deployments • Multi-database platform support |
User review
“What I like best about SolarWinds Database Observability [in particular DPA] is how clearly it shows what’s really happening inside the database. Instead of just alerting that something is slow, it helps pinpoint why it’s slow whether it’s a long-running query, blocking issue, or resource bottleneck.” — Verified G2 user
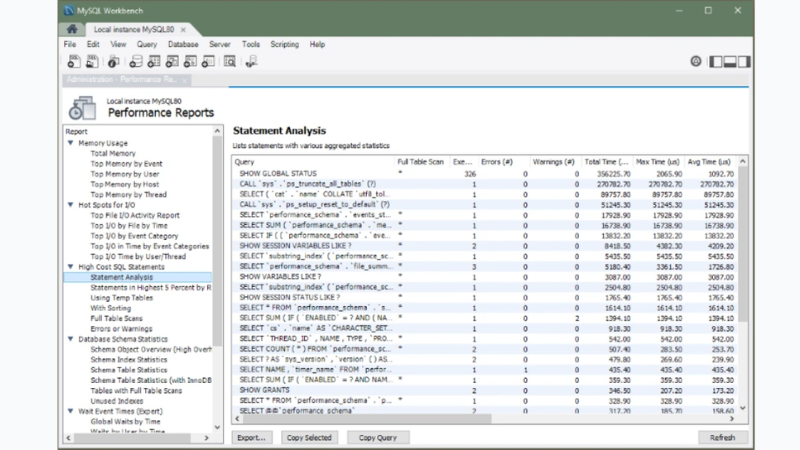
5. MySQL Workbench + Performance Schema/sys

⭐ 4.5/5 (G2)
Best for: Advanced DBAs who prefer native instrumentation and are comfortable interpreting raw performance metrics.
MySQL Workbench combined with Performance Schema and the sys schema represents the most direct and native approach to query profiling. It relies entirely on MySQL’s internal instrumentation, capturing statement digests, wait events, and execution metrics at the engine level without external tooling or abstraction layers.
| Category | Details |
| Features | • Performance Schema statement digests (normalized query grouping) • sys schema performance views and summaries • Query Statistics panel in Workbench • EXPLAIN and EXPLAIN ANALYZE support (MySQL 8.0 and later) • 20+ Performance Schema reports via sys views |
| Pros | • Native MySQL instrumentation • No additional licensing cost • Direct access to engine-level metrics • Highly customizable |
| Cons | • Requires manual interpretation • Less intuitive than commercial tools • Limited centralized monitoring capabilities |
| Price | • Free (included with MySQL Community Edition) |
| Compatibility | • Cross-platform (Windows, macOS, Linux) • Requires MySQL 8.0 and later for EXPLAIN ANALYZE support |
User review
“One of MySQL Workbench's unique advantages is its extensive collection of tools and features that make database maintenance jobs simple and efficient.” — Verified G2 user
Now that the leading tools are outlined, the next step is selecting the profiler that best fits your environment—including identifying what could be considered the best profiler in MySQL for your specific workload.
How to Choose the Best MySQL Profiler Tool
To find the best MySQL tools, use the following criteria.
Profiling Capabilities and Feature Set
A strong MySQL query profiler must expose enough signals to identify root cause, not just confirm that a query is slow. At minimum, it should surface:
- Query latency and execution time
- Wait behavior and resource contention
- Rows examined versus returned
- Execution plan context
Native instrumentation adds depth. Performance Schema groups similar queries using statement digests, allowing you to measure aggregate impact under production load. The sys schema builds on this with views such as statement_analysis, which ranks queries by total latency. More depth means more complexity, so capability must match skill level.
Real-time Insights vs. Historical Analysis
Real-time profiling helps resolve active incidents. Historical profiling helps prevent recurrence. The distinction matters:
- Real-time visibility detects spikes, regressions, and sudden plan changes.
- Historical trends reveal workload drift and release-related slowdowns.
Platform monitoring tools typically excel at long-term correlation across services, while IDE-based profilers excel at rapid iteration when you already suspect a query.
Ease of Use and Learning Curve
Ease of use determines whether profiling becomes routine or avoided. Interpretation burden varies significantly:
- Visual dashboards reduce time to diagnosis.
- Raw metric tables require deeper DBA expertise.
- Native tools depend on correct instrumentation configuration.
If your team includes mixed experience levels, simplicity often delivers more consistent outcomes than raw depth.
Integration with Existing Workflows
A profiler must align with how performance decisions are made. Integration typically falls into one of three patterns:
- IDE integration for optimization during development.
- Monitoring stack alignment for alerts and incident workflows.
- Cloud and infrastructure compatibility for production environments.
Select the tool that fits where changes are shipped: code review, incident response, or database operations.
Pricing and Total Cost of Ownership
Pricing varies widely, and total cost extends beyond the license. Consider subscription fees, training time, operational overhead, and the time required to achieve measurable performance improvement. Current public pricing signals include:
- dbForge Studio: free to $29.95 subscription tiers
- Datadog: $70 per database host per month (annual billing)
- PMM: open source, with operational ownership costs
- SolarWinds DPA: enterprise subscription pricing (~$1,699 public reference)
- MySQL Workbench + Performance Schema/sys: Free; costs come from setup time and ongoing DBA effort.
A practical rule: if a tool does not reduce mean time to diagnose and resolve issues, it is expensive, even when it is “free.”
Conclusion
In modern MySQL environments, profiling is no longer optional: distributed systems and cloud workloads can turn small inefficiencies into real performance and cost problems.
Each tool in this list serves a different purpose depending on where and how performance issues need to be diagnosed. However, for most professional users, dbForge Studio for MySQL stands out as the most balanced option because it combines profiling with the same development environment where optimization work happens, while still supporting deeper analysis when needed.
Download dbForge Studio for MySQL and identify your slowest queries, then confirm performance improvements with before-and-after profiling results.
FAQ
Is there a Built-in Profiler in MySQL?
Yes. MySQL provides built-in instrumentation via Performance Schema and sys schema, which can summarize and analyze statement performance and latency.
Are MySQL Query Profilers Safe to Use in Production?
They can be, but safety depends on the tool and settings. Even native features like EXPLAIN ANALYZE actually run the query, so you should avoid running it against live workloads unless the query is safe to execute.
What Features Should the Best MySQL Profiler Tool Include?
Look for query latency and wait insight, query grouping (digests), execution plan context, and the ability to prioritize by impact (total latency or frequency).
Can MySQL Query Profiling Tools Detect Missing Indexes?
They can strongly suggest it by showing full scans, high rows examined, temp table usage, and slow plan steps, then you validate with execution plans and indexing strategy.
Do Cloud MySQL Profilers Work Better than Desktop Tools?
They’re better for cross-environment visibility, alerting, and long-term trends. Desktop tools are often better for fast iteration while rewriting SQL and testing fixes locally.
What is the Best Profiler for MySQL?
For most developers and DBAs, a profiler integrated into the SQL workflow is usually fastest for diagnosis-to-fix, while platform tools are better for fleet-wide trend monitoring and incident workflows.
Recommended Stories for You


Team SR Mar 17, 2026

Team SR Dec 13, 2025


Team SR Sep 23, 2025

Team SR Mar 24, 2026
Trending Stories

Trusted AI App Development Companies Supporting Business Automation and AI Innovation

Why Streamlined Field Operations Improve Efficiency And Accuracy

What is intellectual property, and how is it protected in the UK

7 Common Branding Mistakes That Kill B2B Tech Conversions

A CEO Ponders How “SaaS SEO Is In a Different Landscape”

The Best rated UK Debt Collection Agencies for 2026

How Founders Can Balance Rapid Growth and Financial Discipline

The Rise of AI Presentation Makers and What It Means for Modern Teams